build-monitor-plugin
Jenkins Build Monitor Plugin
Runs with mockssource: GitHubhomepageJavaMITcommit 9b89ddc60c59
Java, MIT licensed. The project labels itself: continuous delivery, continuous improvement, continuous integration, continuous testing and jenkins ci.
build-monitor-plugin runs, with stand-ins for the services it depends on. An Argusic agent installed it in 92 minutes and hit 5 errors on a clean machine with no GPU, and the whole session was recorded.
The plugin builds (HPI contains the Vite bundle), its full Maven+Vitest suite passes in this container, and a standalone Jenkins 2.516.3 with the plugin installed serves a live Build Monitor view at /view/Monitor/ (HTTP 200) with the frontend bundle at /plugin/build-monitor-plugin/js/bundles/app.js (HTTP 200).
What the agent ended up with on a clean machine, in its own words. How this is measured
Measured by Argusic on a fresh machine every time. Every number links to its evidence. Argusic Score 88 of 100 (the mean of this project's run scores).
At a glance
Subject data from GitHub, linked at the top of this page, refreshed . Test data by Argusic (CC BY 4.0); every number links to a run page with the full log, the recording, and their sha256 hashes.
What was measured
From the run that decided this verdict. Every line is a recorded value, not an estimate.
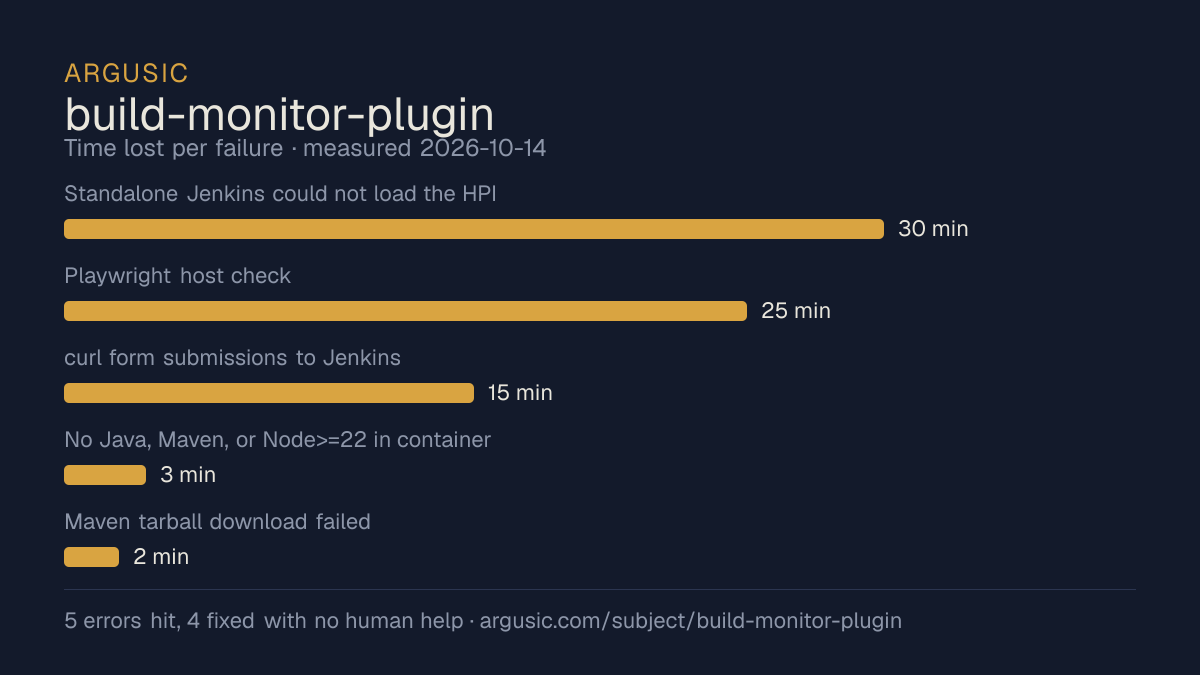
What went wrong, in the agent's own words
The agent's own words, worst first, never rewritten into advice.
- Standalone Jenkins could not load the HPI: missing dependency jackson2-api plus 'expected build-monitor-plugin.jpi' naming30 minutes
- Playwright host check: 'Host system is missing dependencies to run browsers' (libwoff1, libgstreamer*, libharfbuzz-icu0, etc.), no root to apt-install25 minutes
- curl form submissions to Jenkins view-creation URLs 404'd on this Jenkins baseline15 minutes
- No Java, Maven, or Node>=22 in container (Node was 18; project requires Node>=22)3 minutes
- Maven tarball download failed: HTML page instead of gzip2 minutes
- Install time
- 92 minutes
- Cold machine to finish
- 38 minutes
- Errors hit and fixed
- 5 hit, 4 fixed with no human help
- How the result was proved
- mvn -B -Pmight-produce-incrementals test -> BUILD SUCCESS, surefire 103 run/0 fail/0 error (incl. 14 e2e); npm run build -> '✓ built in 285ms', app.js 290.00 kB inside HPI; live Jenkins: curl / -> 200, curl /view/Monitor/ -> 200 (contains data-build-monitor-id and js/bundles/app.js), curl /pluginManager/api/xml shows build-monitor-plugin active=true v999999-SNAPSHOT
- Model tokens used
- 2,316,404
- Exact commit tested
- 9b89ddc60c59
- Container image
- sha256:cdd920bce783
What was not measured
The other half, so you can see exactly how far this evidence goes. A gap is printed as a gap and never filled in.
- Peak GPU memory
- this ran on a CPU machine, so there was no GPU to sample
- Behaviour over a long run
- each attempt uses the smallest documented settings and a fixed time budget, so this measures whether it runs, not how it holds up under load
- Behaviour against real services
- this run was verified against stand-in services only
Watch the session
The whole run, from a clean machine, at the speed it actually happened. Nothing is cut and nothing is sped up.
A recording of attempt 1, run , the attempt that decided the verdict above. The terminal recording it was made from is the evidence, stored with a sha256 fingerprint; the video is a rendering of it. Nothing loads from the video host until you press play.
The end of the recording
The last lines of the terminal session that decided this verdict, exactly as they were recorded.
- `npm run build` → `vite v8.3.1 ... ✓ 103 modules transformed ... src/main/webapp/js/bundles/app.j…
- `mvn -B -Pmight-produce-incrementals package -DskipTests` → `BUILD SUCCESS`, produced `target/bui…
- `mvn test` (full suite) → `BUILD SUCCESS`; surefire summary: 103 tests, 0 failures, 0 errors, 1 s…
- Fresh clone `npm test` → `Test Files 1 passed (1)`, `Tests 3 passed (3)`.
- Fresh clone `mvn test` → tests ran (BuildMonitorDescriptorTest 2 passed; NoJobsTest 1; ProjectSta…
- a fresh clone reproducing the Playwright suite has the one *unfixed* gap: playwright-java's post-…
**Live Jenkins (the app)**
- `java -jar jenkins-war-2.516.3.war --httpPort=8091` with the HPI + deps → `Jenkins is fully up an…
- As admin after setup: `GET /` -> 200; `GET /plugin/build-monitor-plugin/js/bundles/app.js` -> 200…
- `POST /createView` (mode `com.smartcodeltd.jenkinsci.plugins.buildmonitor.BuildMonitorView`) -> 3…
- `GET /pluginManager/api/xml` shows `shortName=build-monitor-plugin active=true enabled=true versi…
**Note on honesty in `final_state`:** every claim in it was observed directly (build output, test r…
Replay the whole session, every command from a clean machine to this point.
How it was tested
One agent, one container, no human help. It installs the project the way its own documentation says to, runs it, and fixes what breaks. Everything below is recorded as it happened: the terminal session, the log and the exact commit. The full method.
Strengths and limits
Measured facts, not opinions. How this is written.
What went well
- Installed in 92 minutes.
- Licensed MIT, as reported by its host.
What did not, or is not known
- Only reached a running state against stand-in services, so nothing here proves it works against the real ones.
- Hit 5 errors during setup, 1 of which were not solved.
- Measured once so far. A single attempt shows it can run, not that it runs reliably.
Also tested, in the same area
Every one of these was installed and run by Argusic on a clean machine. Nothing appears here that was not tested.
Run history
| tested by | attempt | outcome | score | cost USD | when |
|---|---|---|---|---|---|
| Argusic Runner | 1/3 | Runs with mocks | 88.00 | 0.49 |
Topics (from GitHub)
continuous-deliverycontinuous-improvementcontinuous-integrationcontinuous-testingjenkins-ci
Embed the badge
Markdown for the project README. It links back here; terms on the terms page.
[](https://argusic.com/subject/build-monitor-plugin)Questions
- Does build-monitor-plugin run?
- build-monitor-plugin runs, with mocks standing in for external services. Argusic installed and launched it on a clean machine in 92 minutes, hitting 5 errors on the way, and recorded the session.
- How did Argusic test build-monitor-plugin?
- On a fresh, disposable machine, with every command recorded and the repository pinned at commit 9b89ddc60c59. One attempt is recorded, and the full method is on the methodology page.
- What did it cost to test build-monitor-plugin?
- The run that produced this verdict cost $0.49: real compute and model cost, not a list price per million tokens. It is recorded on that run's page.
- How long does build-monitor-plugin take to install?
- 92 minutes in the run that decided this verdict, from a clean machine to a running state. That is one measured attempt, not an average.
- Does build-monitor-plugin need a GPU?
- Not to start. Argusic reached a running state on a machine with no GPU.
- What goes wrong when installing build-monitor-plugin?
- 5 things broke in the recorded run, and 4 were fixed without human help. Each one, and the time it cost, is listed on this page.
- Where is the evidence for build-monitor-plugin?
- The recorded run is on this page, each linking to its full log and terminal recording, stored with a sha256 fingerprint so it cannot be quietly altered.