英語の原文: https://argusic.com/best/uptime-monitoring
オープンソースのアップタイムモニターとステータスページ、テスト済み
自分で実行できるモニタリングとステータスページ。リストは、Argusic が新しいマシンにインストールしたときに各プロジェクトが起動したかどうかで並べられており、その試行の録画はワンクリックで確認できます。
テスト期間: 2026年9月17日 〜 2026年10月30日。各行にそれぞれのテスト日を表示しています。プロジェクトはその日以降に変わっている可能性があります。
テストした 17 件のプロジェクトのうち 17 件が動作します。
要点: テストした 17 件のプロジェクトのうち 15 件が、新しいマシンでそのまま起動しました: gatus、hertzbeat、kener、tinystatus、jump、maintenant、Uptimer、PongHub、ほか 7 件。さらに 2 件が、データベースなど必要なサービスを代わりのものに置き換えたうえで起動しました: tianji、UptimeKit-CLI。
Argusic が毎回新しいマシンで計測しています。 すべての数値は証拠にリンクしています。
| # | プロジェクト | 判定 | Argusic スコア | 言語 | スター | テスト日 |
|---|---|---|---|---|---|---|
| 1 | gatus | 動作する | 100 / 100 | Go | 12,501 | 2026年9月23日 |
開発者向けの自動化されたステータスページで、アラートとインシデント対応を備えています。 テストでわかったこと: Gatus builds from source, launches on port 8080, serves the health API returning 200, monitors all configured HTTP and DNS endpoints, and 74 of 76 Go test packages pass with only ICMP tests failing due to missing CAP_NET_RAW in the unprivileged container. 6 分。 | ||||||
| 2 | hertzbeat | 動作する | 100 / 100 | Java | 7,453 | 2026年9月23日 |
AI を活用した次世代オープンソースのリアルタイム可観測性システム。 テストでわかったこと: HertzBeat server builds, its full Maven test suite passes except one Docker-only integration test, and the assembled server runs with working JWT login and authenticated API on port 1157 in this container. 37 分。 | ||||||
| 3 | kener | 動作する | 100 / 100 | TypeScript | 5,237 | 2026年9月24日 |
美しいステータスページ、必要なものがすべて含まれています。 テストでわかったこと: Kener v4.1.3 is built, serves a status page on port 3000 with SQLite and Redis, all 136 tests pass, health endpoint confirms database and Redis connectivity. 14 分。 | ||||||
| 4 | tinystatus | 動作する | 100 / 100 | Python | 1,588 | 2026年10月6日 |
Python スクリプトで生成される小さなステータスページ テストでわかったこと: TinyStatus installs and runs cleanly out of the box: all 17 unit tests pass, and the app generates a valid status page with proper HTTP/ping/port check results, incident rendering, and history tracking. 2 分。 | ||||||
| 5 | jump | 動作する | 100 / 100 | PHP | 605 | 2026年10月30日 |
Jump は、サーバー向けのセルフホスト型スタートページ兼リアルタイムステータスページであり、シンプルでスタイリッシュ、高速かつ安全になるように設計されています。 テストでわかったこと: Jump runs on PHP 8.3 in the sandbox, serving /, /tag/*, static assets and the status API with real JSON, and reported 7 configured sites (4 online, 3 offline). 35 分。 | ||||||
| 6 | maintenant | 動作する | 100 / 100 | Go | 532 | 2026年10月18日 |
Docker、Kubernetes、アップタイム向けのセルフホスト型監視。単一の Go バイナリ、エージェント設定なし、リアルタイムアラート。コンテナを置くだけで、スタックが監視されます。 テストでわかったこと: maintenant binary builds and runs, serving HTTP 200 on health API and root endpoint, with 42 test suites passing. 6 分。 | ||||||
| 7 | Uptimer | 動作する | 100 / 100 | TypeScript | 483 | 2026年9月19日 |
Cloudflare のエッジネットワーク上の強力なサーバーレスのアップタイム監視 & ステータスページ テストでわかったこと: Uptimer project installs, builds, passes all 488 unit tests across 50 test files, typechecks, lints, and runs locally with the worker API responding with correct data on public and authenticated admin endpoints. 10 分。 | ||||||
| 8 | PongHub | 動作する | 100 / 100 | Go | 224 | 2026年9月20日 |
無料のエンドポイントモニタリング。ワンクリックデプロイ。 テストでわかったこと: PongHub builds, all 4 test packages pass, and the binary runs end-to-end against a real HTTP endpoint, correctly logging success and generating the HTML report. 4 分。 | ||||||
| 9 | upstat | 動作する | 100 / 100 | TypeScript | 200 | 2026年9月20日 |
シンプルなオープンソースのセルフホスト型ステータス監視ツールです。 テストでわかったこと: Upstat Go API builds and runs on port 8000 with SQLite, accepting user signup/signin, creating and listing monitors with heartbeat pings, and serving Swagger docs over HTTP. 17 分。 | ||||||
| 10 | peekaping | 動作する | 96 / 100 | Go | 1,213 | 2026年9月18日 |
最高の Uptime Kuma 代替 テストでわかったこと: Peekaping API server starts on port 8034 with SQLite, connects to local Redis, and responds HTTP 200 on /api/v1/health. All 16 Go test packages pass. The React web frontend builds without errors. 16 分。 | ||||||
| 11 | statuspage | 動作する | 96 / 100 | JavaScript | 768 | 2026年9月19日 |
GitHub Pages と Actions をベースにした、シンプルで依存関係ゼロの純粕な js/html ステータスページ。 テストでわかったこと: Health check script curls 5 URLs and logs results; static server serves index.html, JS, CSS, SVG, config, and 5 log files with 200 status. 3 分。 | ||||||
| 12 | issue-status | 動作する | 96 / 100 | TypeScript | 430 | 2026年9月19日 |
柔軟でモダン、そして非常に高速なステータスページ。 テストでわかったこと: The issue-status monorepo is fully functional: pnpm install succeeds, tests pass (1 passed, 1 skipped/todo), the issue-status package builds via Vite, both CLIs build via tsdown, the example status page app builds and serves correctly via dev/built modes, and the GitHub provider fetches real data from the public... 37 分。 | ||||||
| 13 | server-status | 動作する | 96 / 100 | PHP | 407 | 2026年9月19日 |
シンプルでモダンな見た目のサーバーステータスページです。管理機能といくつかの便利な機能を備え、共有ホスティングでも動作します。 テストでわかったこと: PHP 8.3 and MariaDB 10.11 are running, the server_status database has 11 tables with proper settings, and all pages (index, admin, install, API) respond with HTTP 200 and render correct content without warnings. 27 分。 | ||||||
| 14 | fettle | 動作する | 91 / 100 | TypeScript | 282 | 2026年9月20日 |
無料で、GitHub を利用した美しいステータスページです。GitHub Pages、Actions、Issues を利用して、リアルタイム更新とインシデント管理を行います。スターを付けて、応援してください。 テストでわかったこと: Fettle installs, builds, and exports cleanly (next.config.js patched for image optimization); the production server and the exported static site both serve HTTP 200, and a real headless-browser load of the exported page fetched live GitHub data and showed all systems operational with both services and incidents... 12 分。 | ||||||
| 15 | uptime-kuma | 動作する | 64 / 100 | JavaScript | 93,261 | 2026年9月20日 |
高機能なセルフホスト型監視ツール テストでわかったこと: Uptime Kuma 2.5.3 starts on Node.js 22, listens on port 3001, serves the setup page over HTTP, and passes 196 of 242 backend tests; 38 tests fail solely due to missing Docker and missing ping binary in the container sandbox. 10 分。 | ||||||
| 16 | tianji | モックで動作する | 92 / 100 | TypeScript | 3,118 | 2026年9月17日 |
Tianji: あらゆるものへの洞察、Website Analytics + Uptime Monitor + Server Status。単なる別の GA 代替品ではありません。 テストでわかったこと: Dependencies installed, project builds successfully, shared and most server unit tests pass, client component tests mostly pass; server cannot launch without a PostgreSQL database. 25 分。 | ||||||
| 17 | UptimeKit-CLI | モックで動作する | 92 / 100 | JavaScript | 277 | 2026年9月20日 |
モダンでクロスプラットフォームな、Web サイトと API を監視するための CLI。 テストでわかったこと: The project builds, its 246-unit test suite passes 6/6 suites, and the CLI starts a background daemon, adds HTTP/DNS/SSL monitors, and renders a live TUI dashboard with real monitoring data (DNS resolution, SSL certificate validation, HTTP checks). The edit command was fixed to accept 0 retries. Node 22 is required. 18 分。 | ||||||
動作する 実際の依存関係でインストールされ、起動しました。 モックで動作する データベースやサードパーティの API などの外部サービスを代わりのものに置き換えたうえで起動しました。 検証できず 標準のエージェントもより強力なエージェントも、制限時間内に動かせませんでした。どこで止まったかはログで確認できます。
選ぶ前に
Decide whether you want to run a database. Five projects started as-is with an embedded or SQLite store (gatus, PongHub, upstat, hertzbeat, and kener, which also brought up a real Redis); three expected a Redis, MySQL, or PostgreSQL that the agent had to stand in for (peekaping, server-status, tianji). The verdict column and the finding under each name tell you which group a project is in before you read its README.
Decide whether you need monitoring or only a status page. statuspage and fettle are static sites that publish a status you feed them; they cannot probe anything themselves. gatus, uptime-kuma, and peekaping run the checks and host the page. tianji goes further and bundles web analytics; it is also on the self-hosted analytics list, with its own rank there.
Look at the minutes. The time each verifying run took is a fair proxy for how much a first install asks of you: 7 to 12 minutes for the single-binary and static projects, 23 to 38 for the ones that build a full stack (hertzbeat, issue-status, server-status, upstat).
Read the finding before the star count. uptime-kuma has the most stars by far and still ranks twelfth, because on its test day it started only after a pre-built front end was downloaded and 46 of its 240 backend tests failed; the row says so, and the log shows it.
テスト方法
モニターまたはステータスページの場合、動作するとは、クリーンなマシン上でサーバープロセスが起動し、HTTP で応答することを意味しました。つまり、Web UI またはヘルスエンドポイントが応答し、プロジェクトがテストスイートを提供している場合は、そのスイートが実行されました。
このリストの判定を分けたのは、二つの点です。単一のバイナリまたはバンドルされた SQLite ストアを備えたプロジェクトは、そのまま起動しました。例えば、gatus は実際の HTTP および DNS チェックをライブエンドポイントに対して実行しました。データベース、キャッシュ、またはメッセージキューを必要とするプロジェクトは、エージェントがそのサービスを代行して初めて起動しました。peekaping はプロセス内の Redis を必要とし、server-status はローカルの MySQL、tianji は抽出されたパッケージから構築された PostgreSQL を必要としました。これらは「モックで動作する」です。
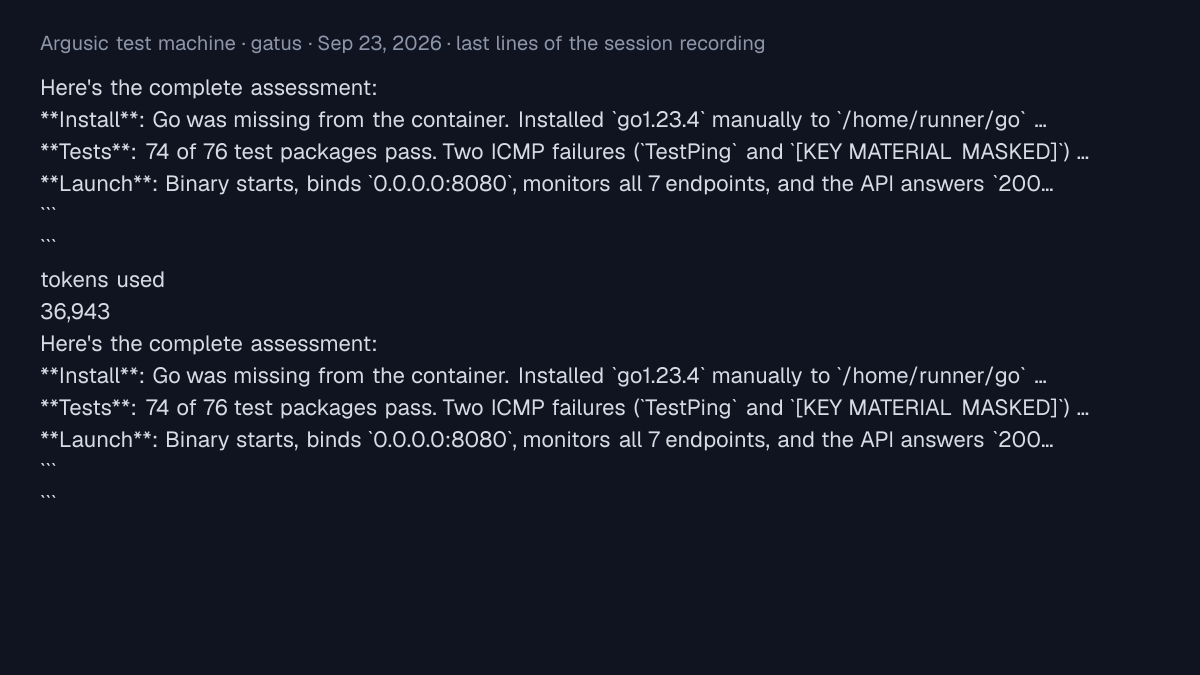
コンテナが提供しないインフラストラクチャを必要とするチェック(たとえば、ICMP ping(raw ソケット)や Docker)は、ログで失敗したテストとして表示されますが、サーバー自体が起動している場合は判定を妨げませんでした。uptime-kuma は最も明確な例です。静的ステータスページはローカルでビルドおよび提供されました。statuspage と fettle がその例です。
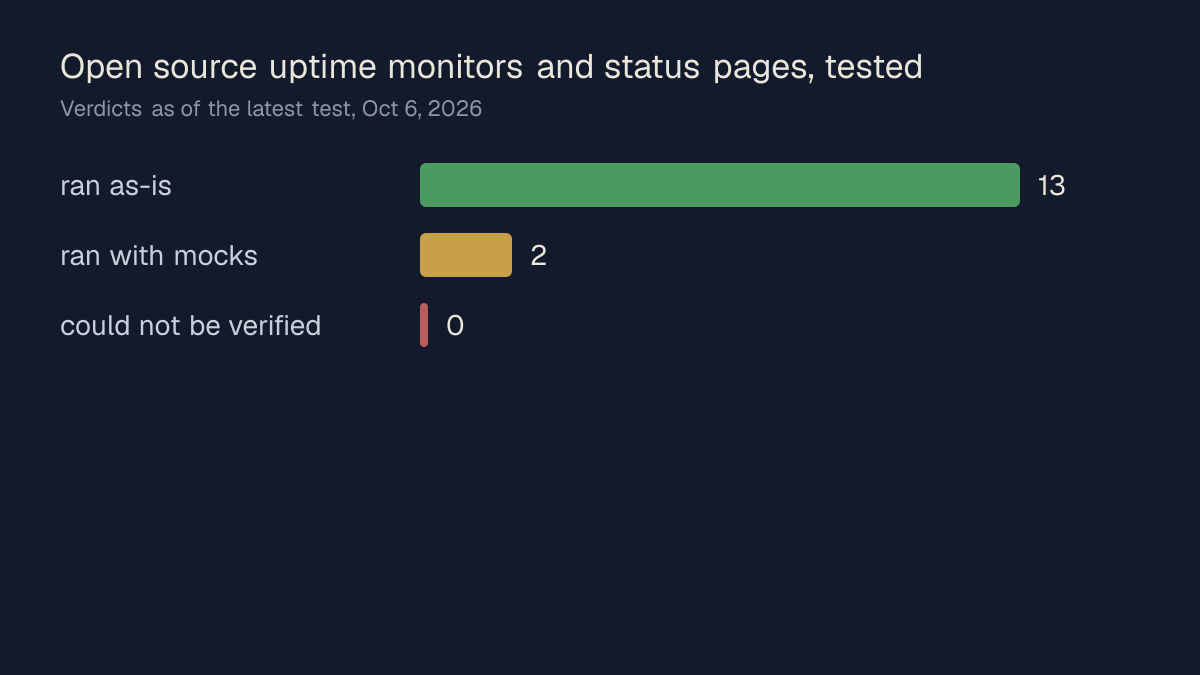
最新のテスト時点でのこのリスト: そのまま動作 15 件、モックで動作 2 件、検証できず 0 件。テストした言語: Go、Java、JavaScript、PHP、Python、TypeScript。すべての試行で、クリーンな使い捨てのマシン、固定されたバージョンのプロジェクト、45 分の制限時間を使用しています。手順の全体は評価方法のページに掲載しています。
よくある質問 (FAQ)
アップタイムモニターにおける「動作する」とはどういう意味ですか?
サーバーはクリーンなマシンで起動し、HTTP 経由で応答しました。テストスイートが存在する場合は、それが実行されました。これはすべてのチェックタイプが動作することを意味するわけではありません。ping はコンテナにない raw-socket 権限を必要とし、それはログ内の失敗したテストとして表示され、判定には影響しません。
なぜ uptime-kuma がトップにないのですか?
ランクは測定されたものであり、編集によるものではありません。テスト日には、エージェントが事前にビルドされたフロントエンドをダウンロードし、タイムアウト用のシムをパッチした後にのみサーバーが起動しました。また、Docker や ping を必要とするテストは失敗しました。これは「モックで動作する」であり、そのまま起動したプロジェクトよりも低いランクになります。ログはその行からワンクリックで確認できます。
これらはセルフホストするためにデータベースが必要ですか?
プロジェクトによります。このリストのいくつかは SQLite で動作したか、データベースをまったく使用しませんでした。「モックで動作する」とマークされたものは、エージェントが代わりに立ち上げる必要があるサービス(Redis、MySQL、PostgreSQL など)が必要でした。各プロジェクトのページに、どのサービスが必要か記載されています。
静的ステータスページも同じ方法でテストされますか?
はい。エージェントがサイトをビルドし、出力をローカルで配信しました。statuspage と fettle がその例です。静的ページは単独では何も監視できないため、質問のステータスページ部分にのみ答えることになります。
このリストはどのくらい最新ですか?
各行には独自のテスト日が記載され、ページには期間が示されています。プロジェクトはテスト後に変更される可能性があります。新しい試行は、完全な証拠が揃った場合にのみ判定を置き換えます。
このリストはどのようにランク付けされていますか?
意見ではなく計測によります: Argusic が新しいマシンにインストールして起動できたプロジェクトが先、次に外部サービスの代わりにモックを使って動作したもの、次に検証できなかったものです。同順位の場合は Argusic スコア、次にプロジェクト自身のソースでの人気度で決めます。
証拠はどこにありますか?
各行はプロジェクトの Argusic ページにリンクしており、各実行には完全なログとターミナル録画が sha256 フィンガープリントとともに保存されています。このリストに載っているかどうかにかかわらず、テストしたすべてのプロジェクトに同じページがあります。
このカテゴリのその他のリスト
- オープンソースの可観測性およびログ記録、インストールして実行 (このリストと共通: hertzbeat、kener)
- セルフホスト型ダッシュボードとホームページ、インストールして実行 (このリストと共通: gatus、jump)
- インストールおよびクエリ可能なオープンソースデータベース (このリストと共通: hertzbeat)
- オープンソースのセルフホスト型アナリティクス、クリーンなサーバーでテスト済み (このリストと共通: tianji)
- オープンソースの AI エージェントフレームワーク、インストール・実行
- 自分で実行できるオープンソースの AI アプリ、テスト済み
- オープンソースの API クライアント、ビルド・実行済み
- オープンソース API ゲートウェイとリバースプロキシ、テスト済み
- インストールして実行したオープンソース CI/CD ツール
- インストールして実行するオープンソース CMS プラットフォーム
- オープンソース LLM ゲートウェイ、インストール・実行
- 初回実行で起動するオープンソース MCP サーバー
- オープンソースの VPN およびネットワークツール、インストール・実行
- オープンソースのバックアップツール、インストールして実行
- オープンソースのブラウザ自動化ツール(インストールして実行)
- オープンソースのコードエディタと IDE、ビルドと起動
- 新しいマシンで実行されたオープンソースのコーディングエージェント
- オープンソースの開発者向け CLI ツール、ビルドと実行で実証済み
- インストールして実行するオープンソースの e コマースプラットフォーム
- オープンソースの電子書籍リーダーとライブラリ、テスト済み
- オープンソースのゲームエンジン、ビルドと実行
- 新しいマシンでビルドして起動したオープンソースゲーム
- インストールして実行するオープンソースのホームオートメーション
- テスト済みのオープンソースのローコード・ノーコードプラットフォーム
- オープンソースの地図サーバーとツール、インストールと実行
- オープンソースのメッセージキューとストリーミング、テスト済み
- オープンソースの音楽サーバー、インストールして再生
- オープンソースのオフィススイート、インストールして起動
- セルフホスト可能なオープンソースのパスワードマネージャー、テスト済み
- インストールして実行するオープンソースのプロジェクト管理ツール
- オープンソースのスクリーンレコーダー、開発・公開
- インストールおよびクエリ可能なオープンソース検索エンジン
- オープンソースの音声認識と音声合成、テスト済み
- オープンソースの静的サイトジェネレーター、ビルドと配信
- オープンソースのベクターデータベース、インストールしてクエリを実行
- 新しいマシンで起動したオープンソースのビデオエディター
- オープンソースのビデオプレーヤー、開発・公開
- インストールして実行するオープンソースの Web スクレイピングツール
- オープンソースのホワイトボードと図表ツール、テスト済み
- セルフホスト可能なオープンソースの Wiki、テスト済み
- オープンソースのワークフロー自動化、インストールして実行
- セルフホスト型 Notion の代替ツール、実インストールで検証
- 新しいマシンで起動したセルフホスト型 Git サーバー