YouPlot
A command line tool that draw plots on the terminal.
Runssource: GitHubRubyMITcommit e67219ca88cc
Ruby, MIT licensed. The project labels itself: cli, csv, ruby, terminal, tsv, tui and visualization.
YouPlot runs. An Argusic agent installed it in 10.1 minutes and hit 3 errors and fixed every one without help on a clean machine with no GPU, and the whole session was recorded.
YouPlot 0.5.0 installed and working: uplot bar/hist/line/scatter/density/boxplot all produce terminal plots; 109 unit tests pass with 0 failures.
What the agent ended up with on a clean machine, in its own words. How this is measured
Measured by Argusic on a fresh machine every time. Every number links to its evidence. Argusic Score 100 of 100 (the mean of this project's run scores).
At a glance
Subject data from GitHub, linked at the top of this page, refreshed . Test data by Argusic (CC BY 4.0); every number links to a run page with the full log, the recording, and their sha256 hashes.
What was measured
From the run that decided this verdict. Every line is a recorded value, not an estimate.
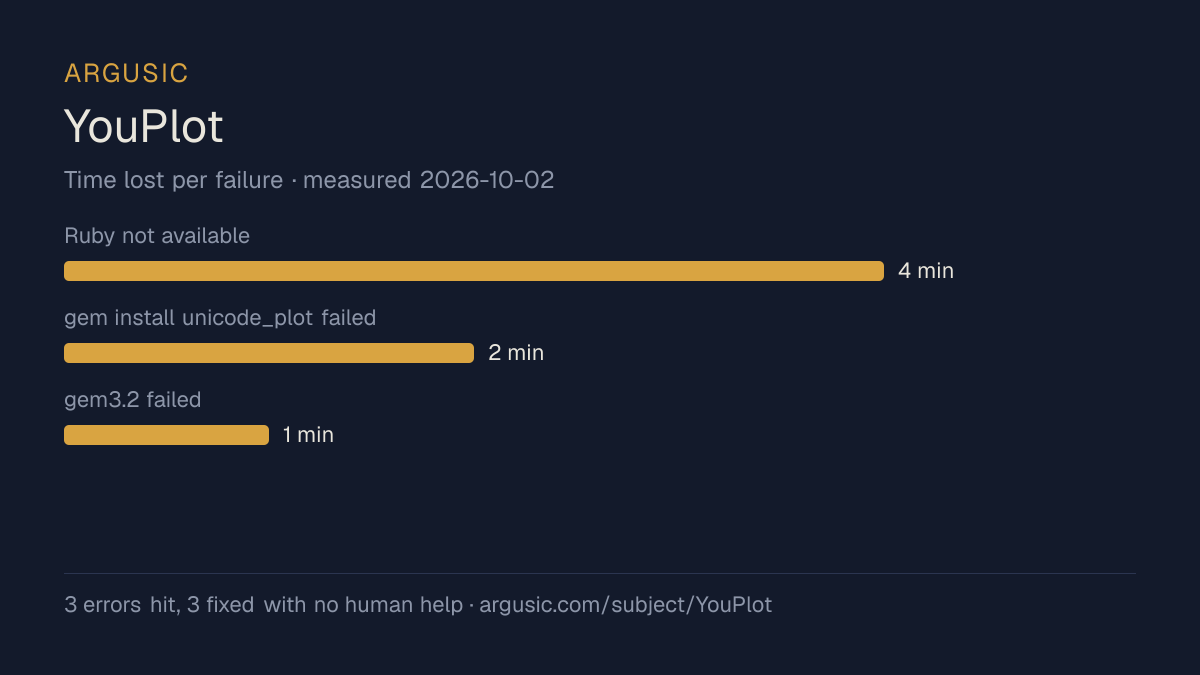
What went wrong, in the agent's own words
The agent's own words, worst first, never rewritten into advice.
- Ruby not available (no system install)4 minutes
- gem install unicode_plot failed: no ruby.h (missing ruby-dev)2 minutes
- gem3.2 failed: missing libyaml shared library1 minute
- Install time
- 10 minutes
- Cold machine to finish
- 10 minutes
- Errors hit and fixed
- 3 hit, 3 fixed with no human help
- How the result was proved
- bundle exec rake test exited 0: 109 tests, 168 assertions, 0 failures, 0 errors, 87.5% line coverage
- Model tokens used
- 65,663
- Exact commit tested
- e67219ca88cc
- Container image
- sha256:cdd920bce783
What was not measured
The other half, so you can see exactly how far this evidence goes. A gap is printed as a gap and never filled in.
- Peak GPU memory
- this ran on a CPU machine, so there was no GPU to sample
- Behaviour over a long run
- each attempt uses the smallest documented settings and a fixed time budget, so this measures whether it runs, not how it holds up under load
The end of the recording
The last lines of the terminal session that decided this verdict, exactly as they were recorded.
end = $(date +%s)
mins = (end - start) / 60
print(f'"'Elapsed: {mins:.1f} minutes')
\"" in /work/repo
 succeeded in 0ms:
Start: 1790936133
Now: 1790936737
Elapsed: 10.1 minutes
The install, test, and verification are all done. Here's the report:
tokens used
65,663
The install, test, and verification are all done. Here's the report:
Replay the whole session, every command from a clean machine to this point.
How it was tested
One agent, one container, no human help. It installs the project the way its own documentation says to, runs it, and fixes what breaks. Everything below is recorded as it happened: the terminal session, the log and the exact commit. The full method.
Strengths and limits
Measured facts, not opinions. How this is written.
What went well
- Reached a running state on a clean machine, with the session recorded.
- Recovered from all 3 errors without a human stepping in, which says the failures are documented well enough to solve.
- Ran without a GPU, so it does not need one to start.
- Licensed MIT, as reported by its host.
What did not, or is not known
- Took 10.1 minutes to install, slower than the median of the 41 comparable projects Argusic has measured.
- Measured once so far. A single attempt shows it can run, not that it runs reliably.
Of the 42 cli projects Argusic has installed and timed, YouPlot was the 33rd fastest to reach a running state, and 38 of 42 reached one at all.
What it is a reasonable choice for
- Trying it on a laptop or a small server: it reached a running state without a GPU.
Also tested, in the same area
Every one of these was installed and run by Argusic on a clean machine. Nothing appears here that was not tested.
Run history
Topics (from GitHub)
Embed the badge
Markdown for the project README. It links back here; terms on the terms page.
[](https://argusic.com/subject/youplot)Questions
- Does YouPlot run?
- Yes. YouPlot runs. Argusic installed and launched it on a clean machine in 10 minutes, hitting 3 errors on the way, and recorded the session.
- How did Argusic test YouPlot?
- On a fresh, disposable machine, with every command recorded and the repository pinned at commit e67219ca88cc. One attempt is recorded, and the full method is on the methodology page.
- What did it cost to test YouPlot?
- The run that produced this verdict cost $0.05: real compute and model cost, not a list price per million tokens. It is recorded on that run's page.
- How long does YouPlot take to install?
- 10.1 minutes in the run that decided this verdict, from a clean machine to a running state. That is one measured attempt, not an average.
- Does YouPlot need a GPU?
- Not to start. Argusic reached a running state on a machine with no GPU.
- What goes wrong when installing YouPlot?
- 3 things broke in the recorded run, and 3 were fixed without human help. Each one, and the time it cost, is listed on this page.
- How does YouPlot compare with the alternatives?
- Of the 42 cli projects Argusic has installed and timed, YouPlot was the 33rd fastest to reach a running state, and 38 of 42 reached one at all.
- Where is the evidence for YouPlot?
- The recorded run is on this page, each linking to its full log and terminal recording, stored with a sha256 fingerprint so it cannot be quietly altered.